Retail Reports
ANALYTICS Tool
Role
Lead Designer
collaborators
Annika Berger (Design)
Matteo Gamba (Dev)
The GOAL
Empower retail managers to quickly find and act on key mall metrics. Allowing managers to draw smart AI-driven insights from complex data sets that allows them to make informed decisions.

UXR
There was a strong demand for actionable insights derived from the data shown in the graphs, enabling retail managers to make informed decisions and drive business growth strategies.
Decision Making
How do retail managers seek insights? On which data are decisions based on?

Habits
How do operators interact with the retail dashboard, what numbers are reviewed daily?

Situational awareness
What insights, trends and analysis should be readily available? How can we provide better insights into their business?

Priorisation
How can we best track visitor insights and footfall numbers?
Challenge
The existing retail dashboard was a maze of complex data and a tech-heavy interface, making it tough for users to navigate and extract insights.
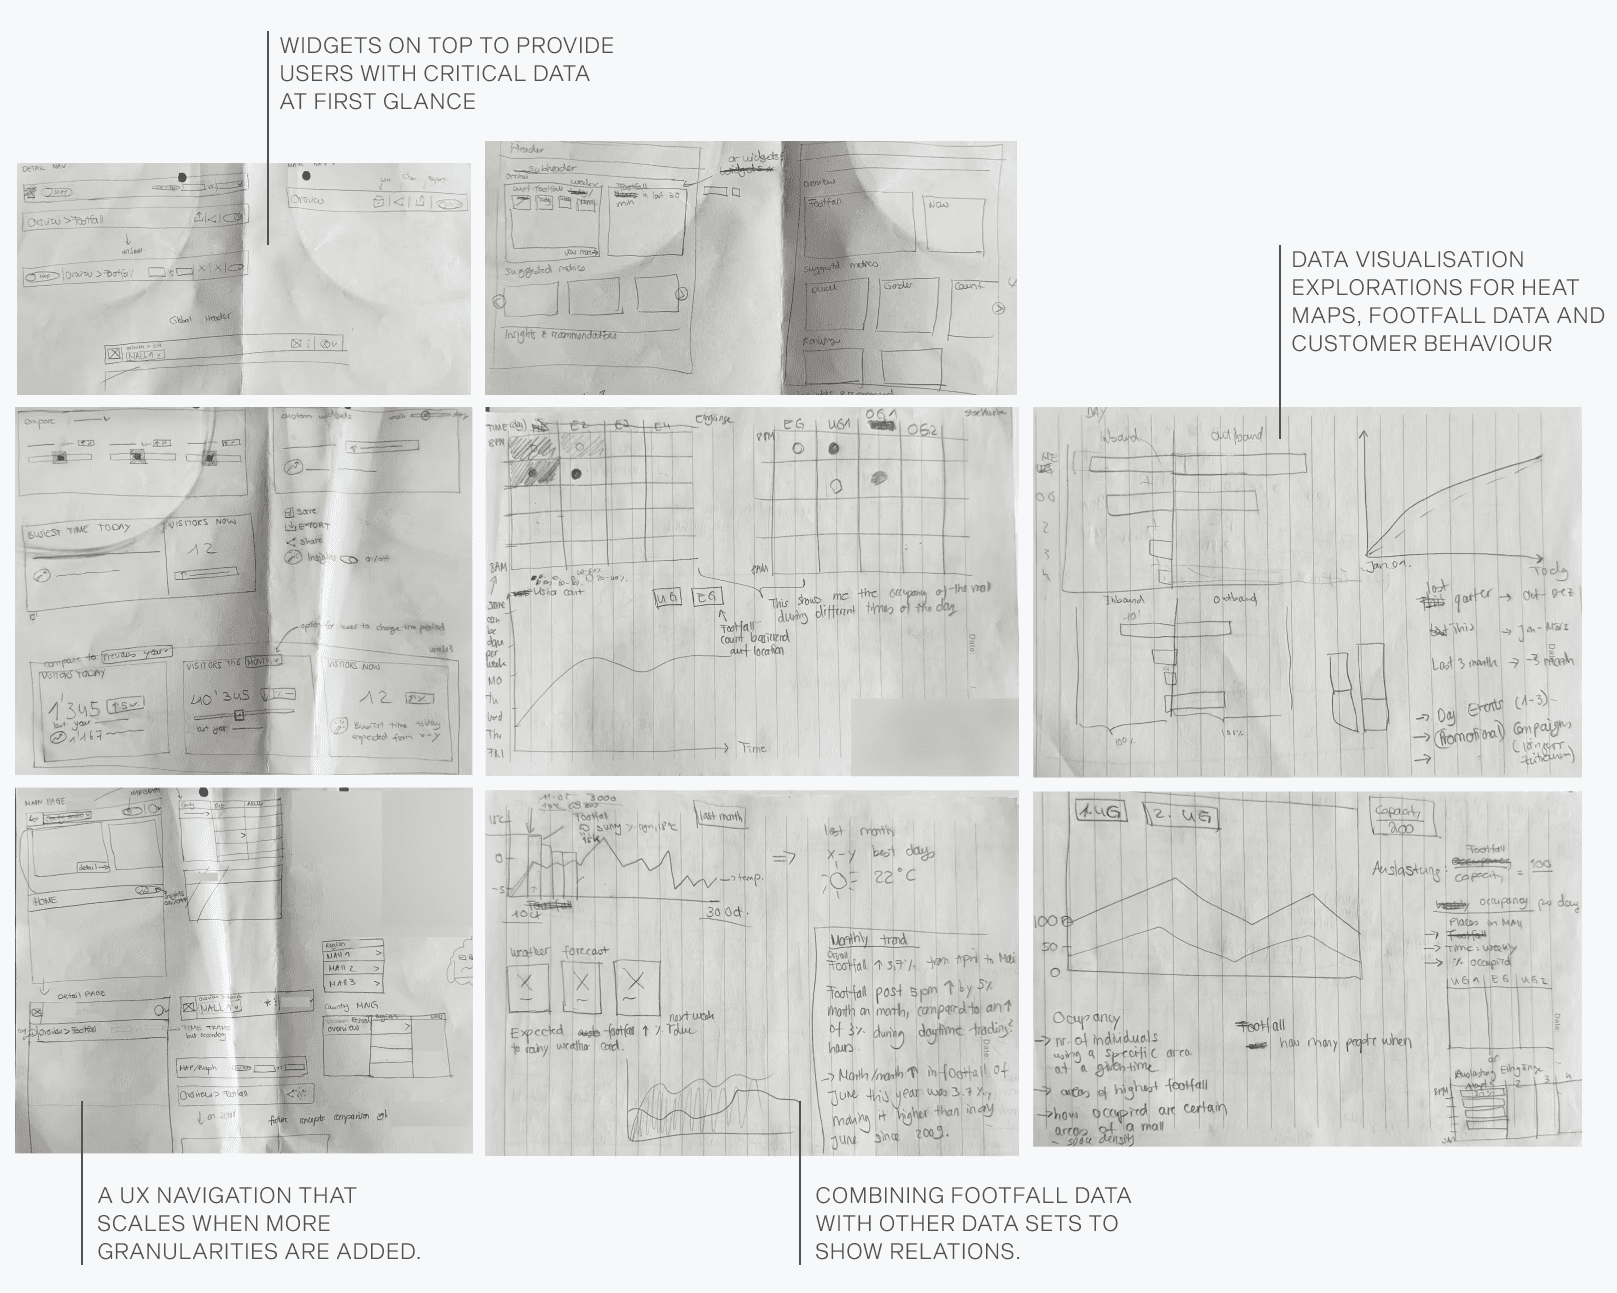
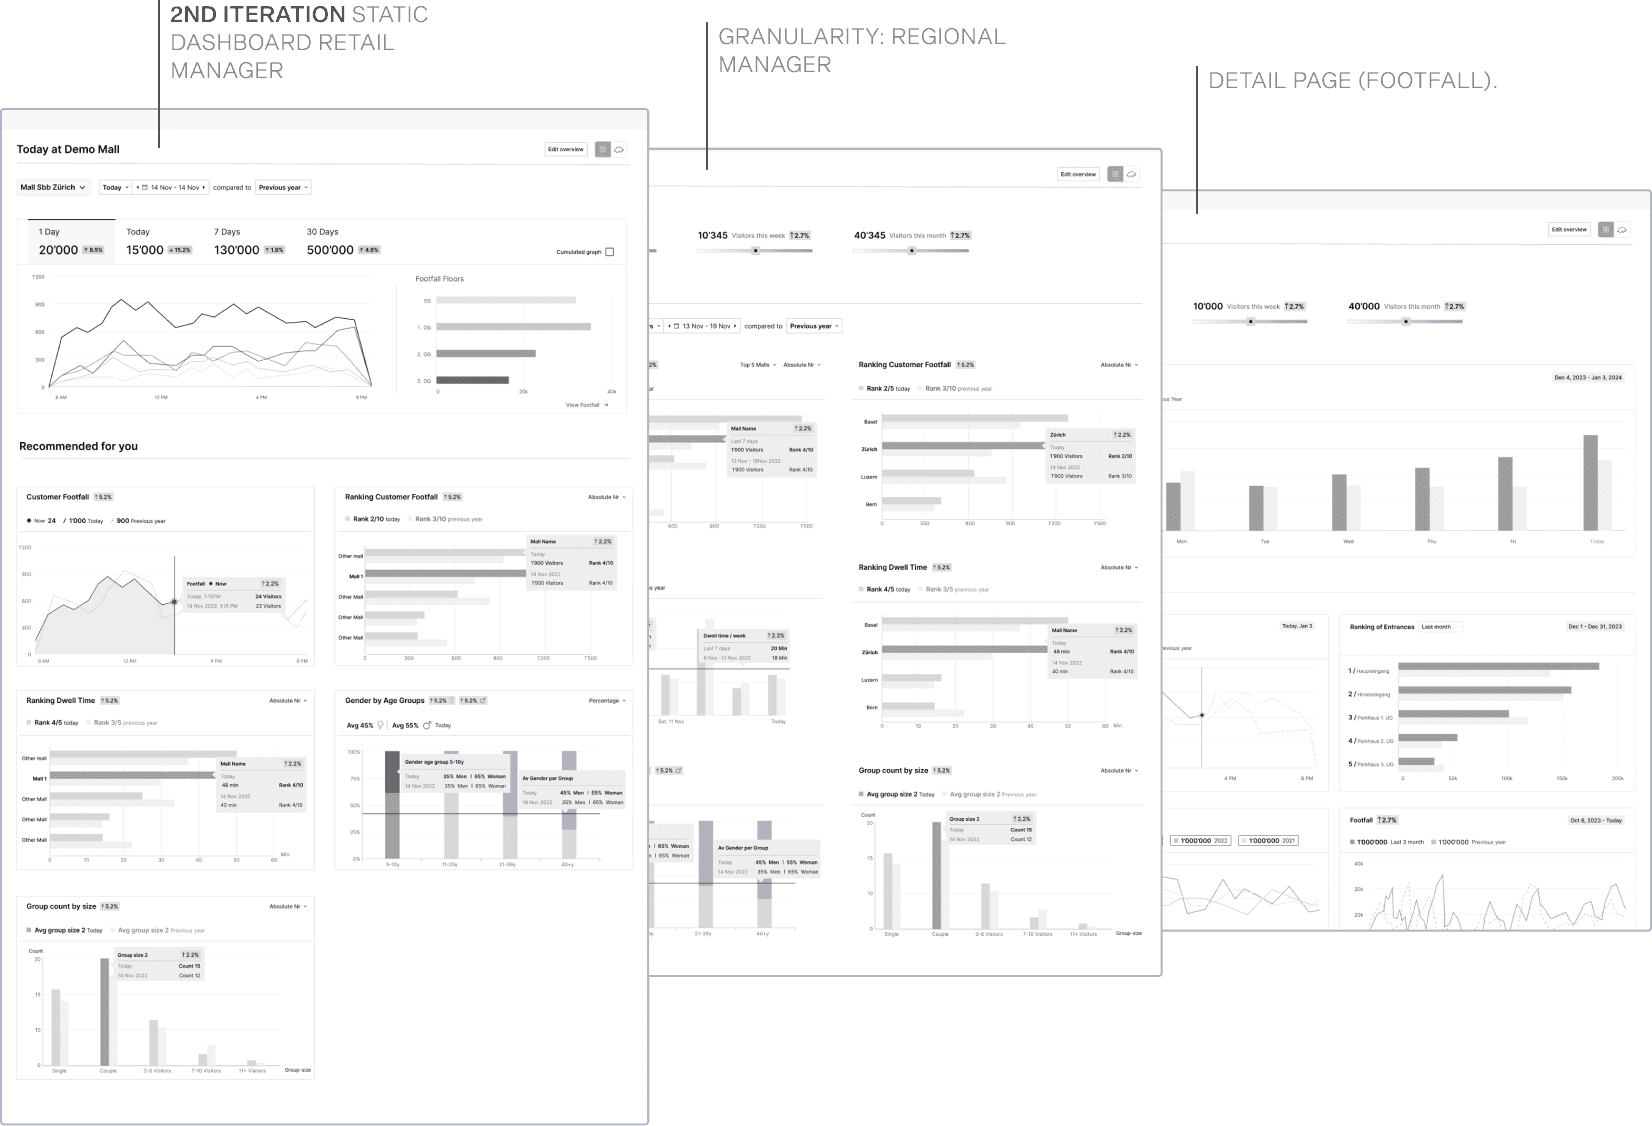
Sketching concepts of graphs, navigation, widgets and home screen layouts helped us prioritize the UX navigation and lay out key metrics. With managers at various levels of retail overseeing multiple regions, we started by focusing on the frontline mall manager's requirements. Our mission was to simplify the interface, balance user needs with visual clarity, and set the stage for scalable solutions across all retail management levels. We designed sample sections for trends and recommendations on the base of real mall data, distilling complex information into clear, digestible insights.
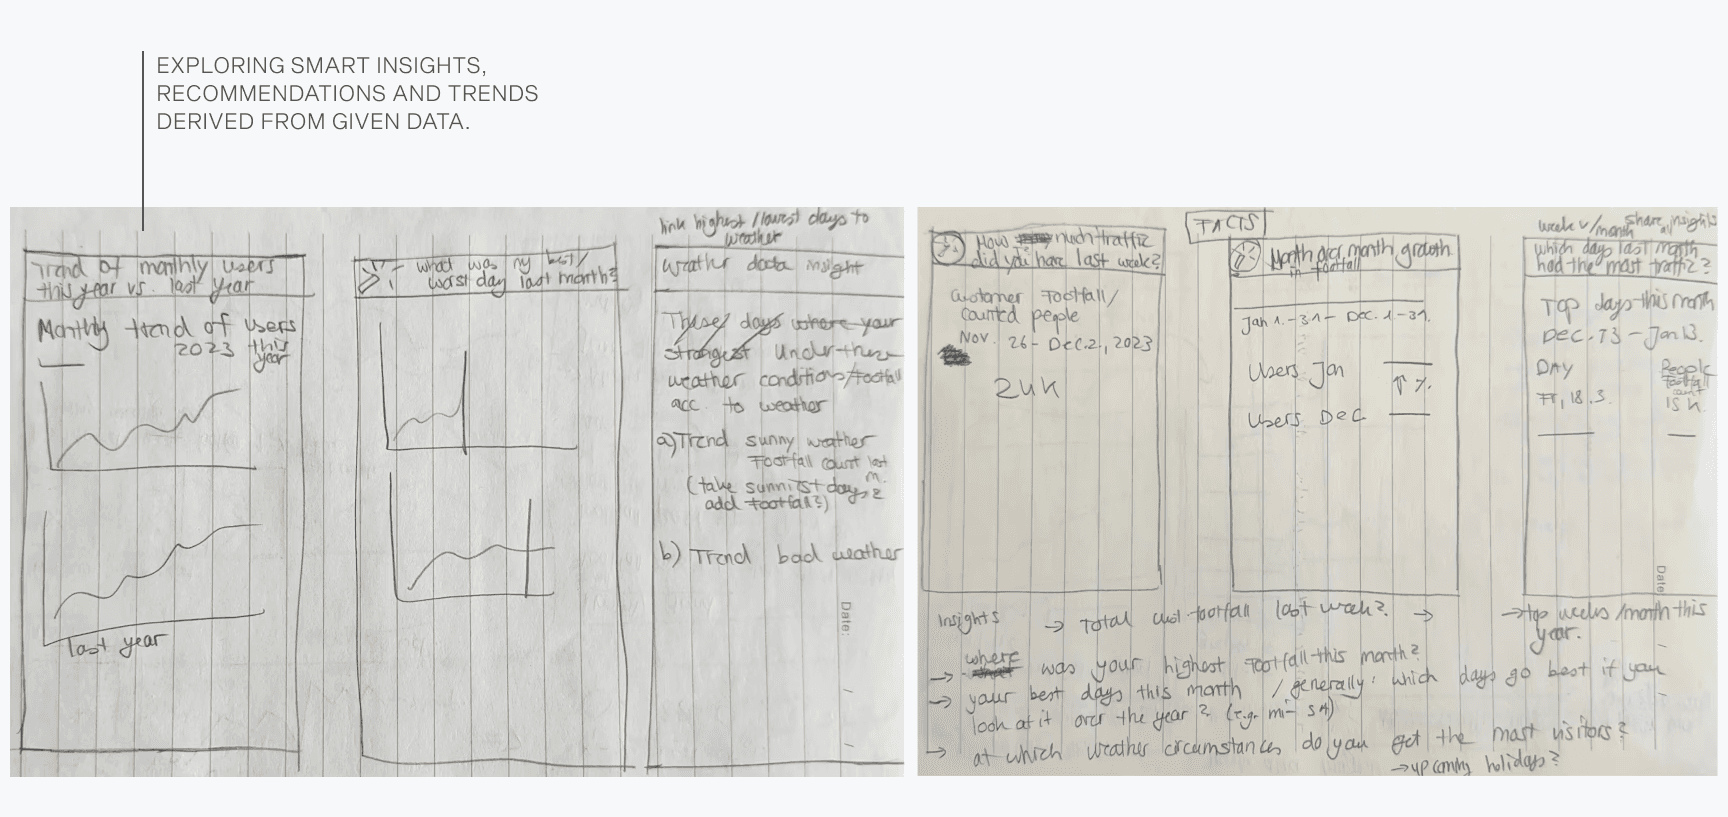
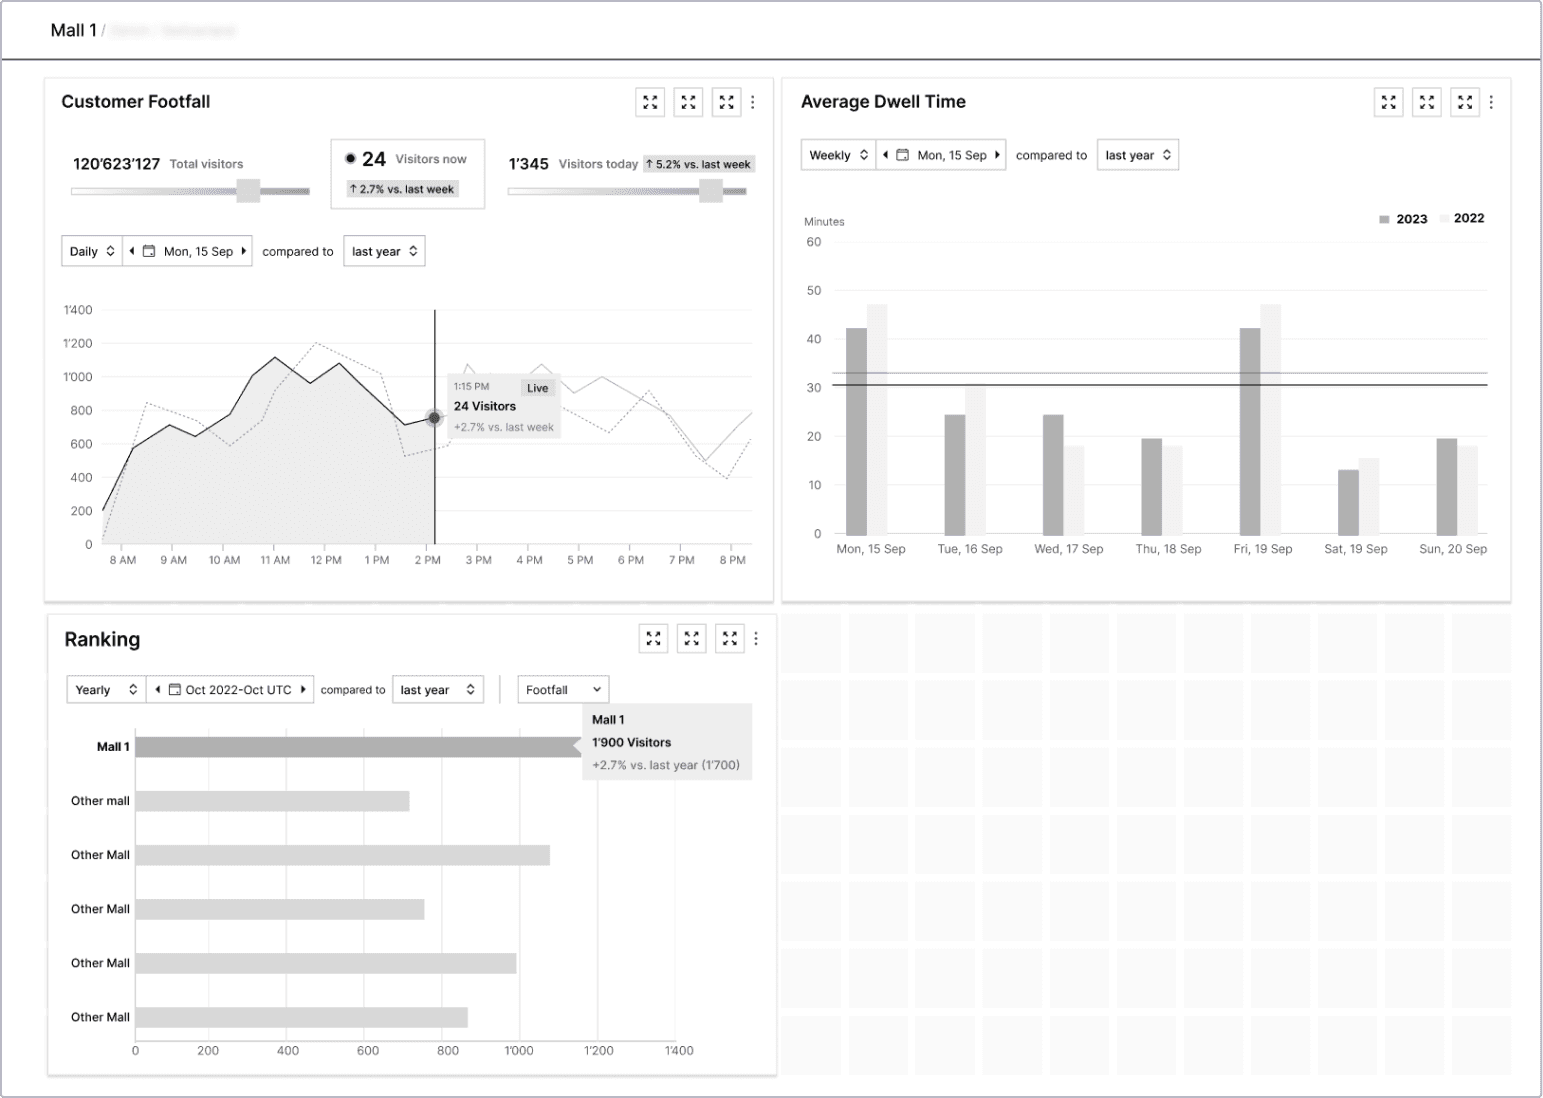
We did several iterations. At first, we started out with a custom built grid-view dashboard and focused on footfall metrics. The second iteration revealed that the default retail dashboard should be static for the novice user. A primary graph at the top combines different data sets to give a fast and detailed overview of the footfall numbers in different parts of the mall. Ranking turned out to be important for mall managers to understand their performance in relation to competitors. At last, we delved into insights, researching and drafting analytical recommendations derived from our designed graphs, with a focused on trends and insights.
FINAL EXPERIENCE
Usability testings of the MVP have brought 90% positive feedback. The MVP is the starting point for the client's new product and further product development.
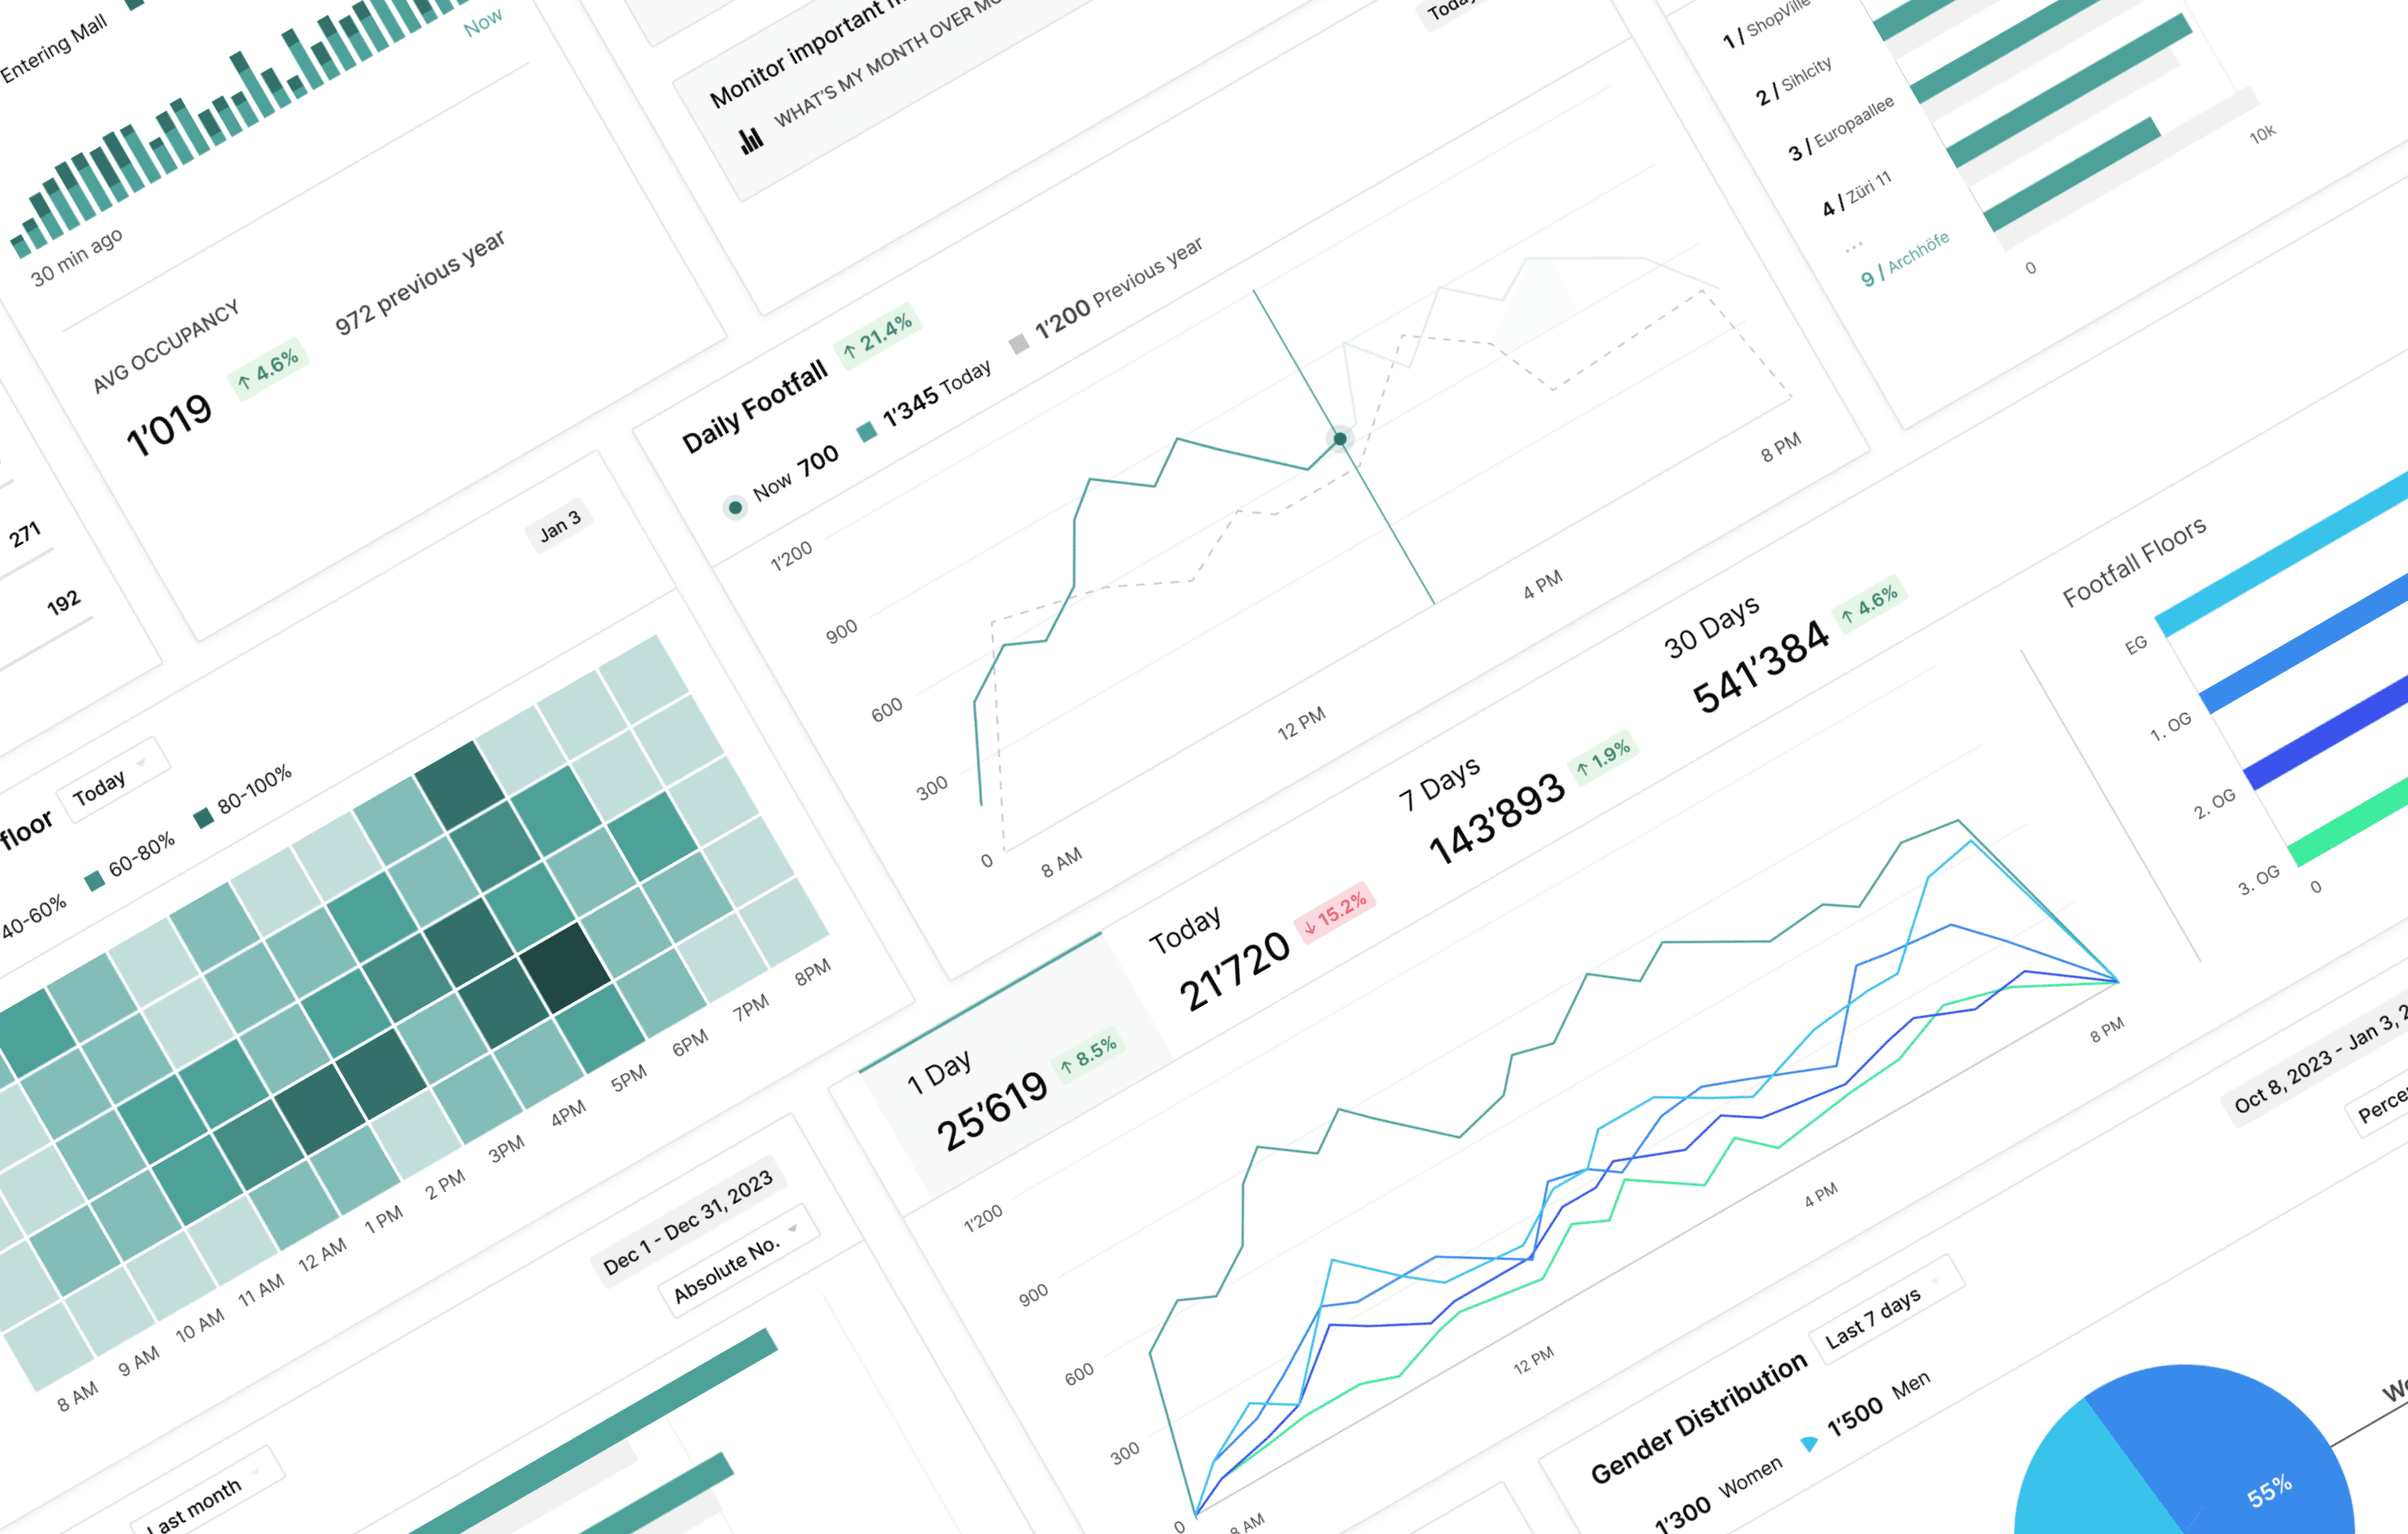
Different widgets on top of the mall manager's dashboard display live information and relevant data points to enable them to quickly oversee the state of the mall without scrolling further down. Primary graph with different time periods to quickly scan the state of the mall today and over time.
Mall Manager Detail Page – Showing predictions and insights on top of the dashboard to allow for quick scanning of key metrics. Footfall evolution focusing on different time periods, allowing operators to compare footfall evolution over time.
The next section is a series of graphs we suggest based on our user research insights, customised for each manager level. It features suggested graphs that go deeper into key metrics and additional metrics that provide a deeper insight into the mall performance and customer behaviour.
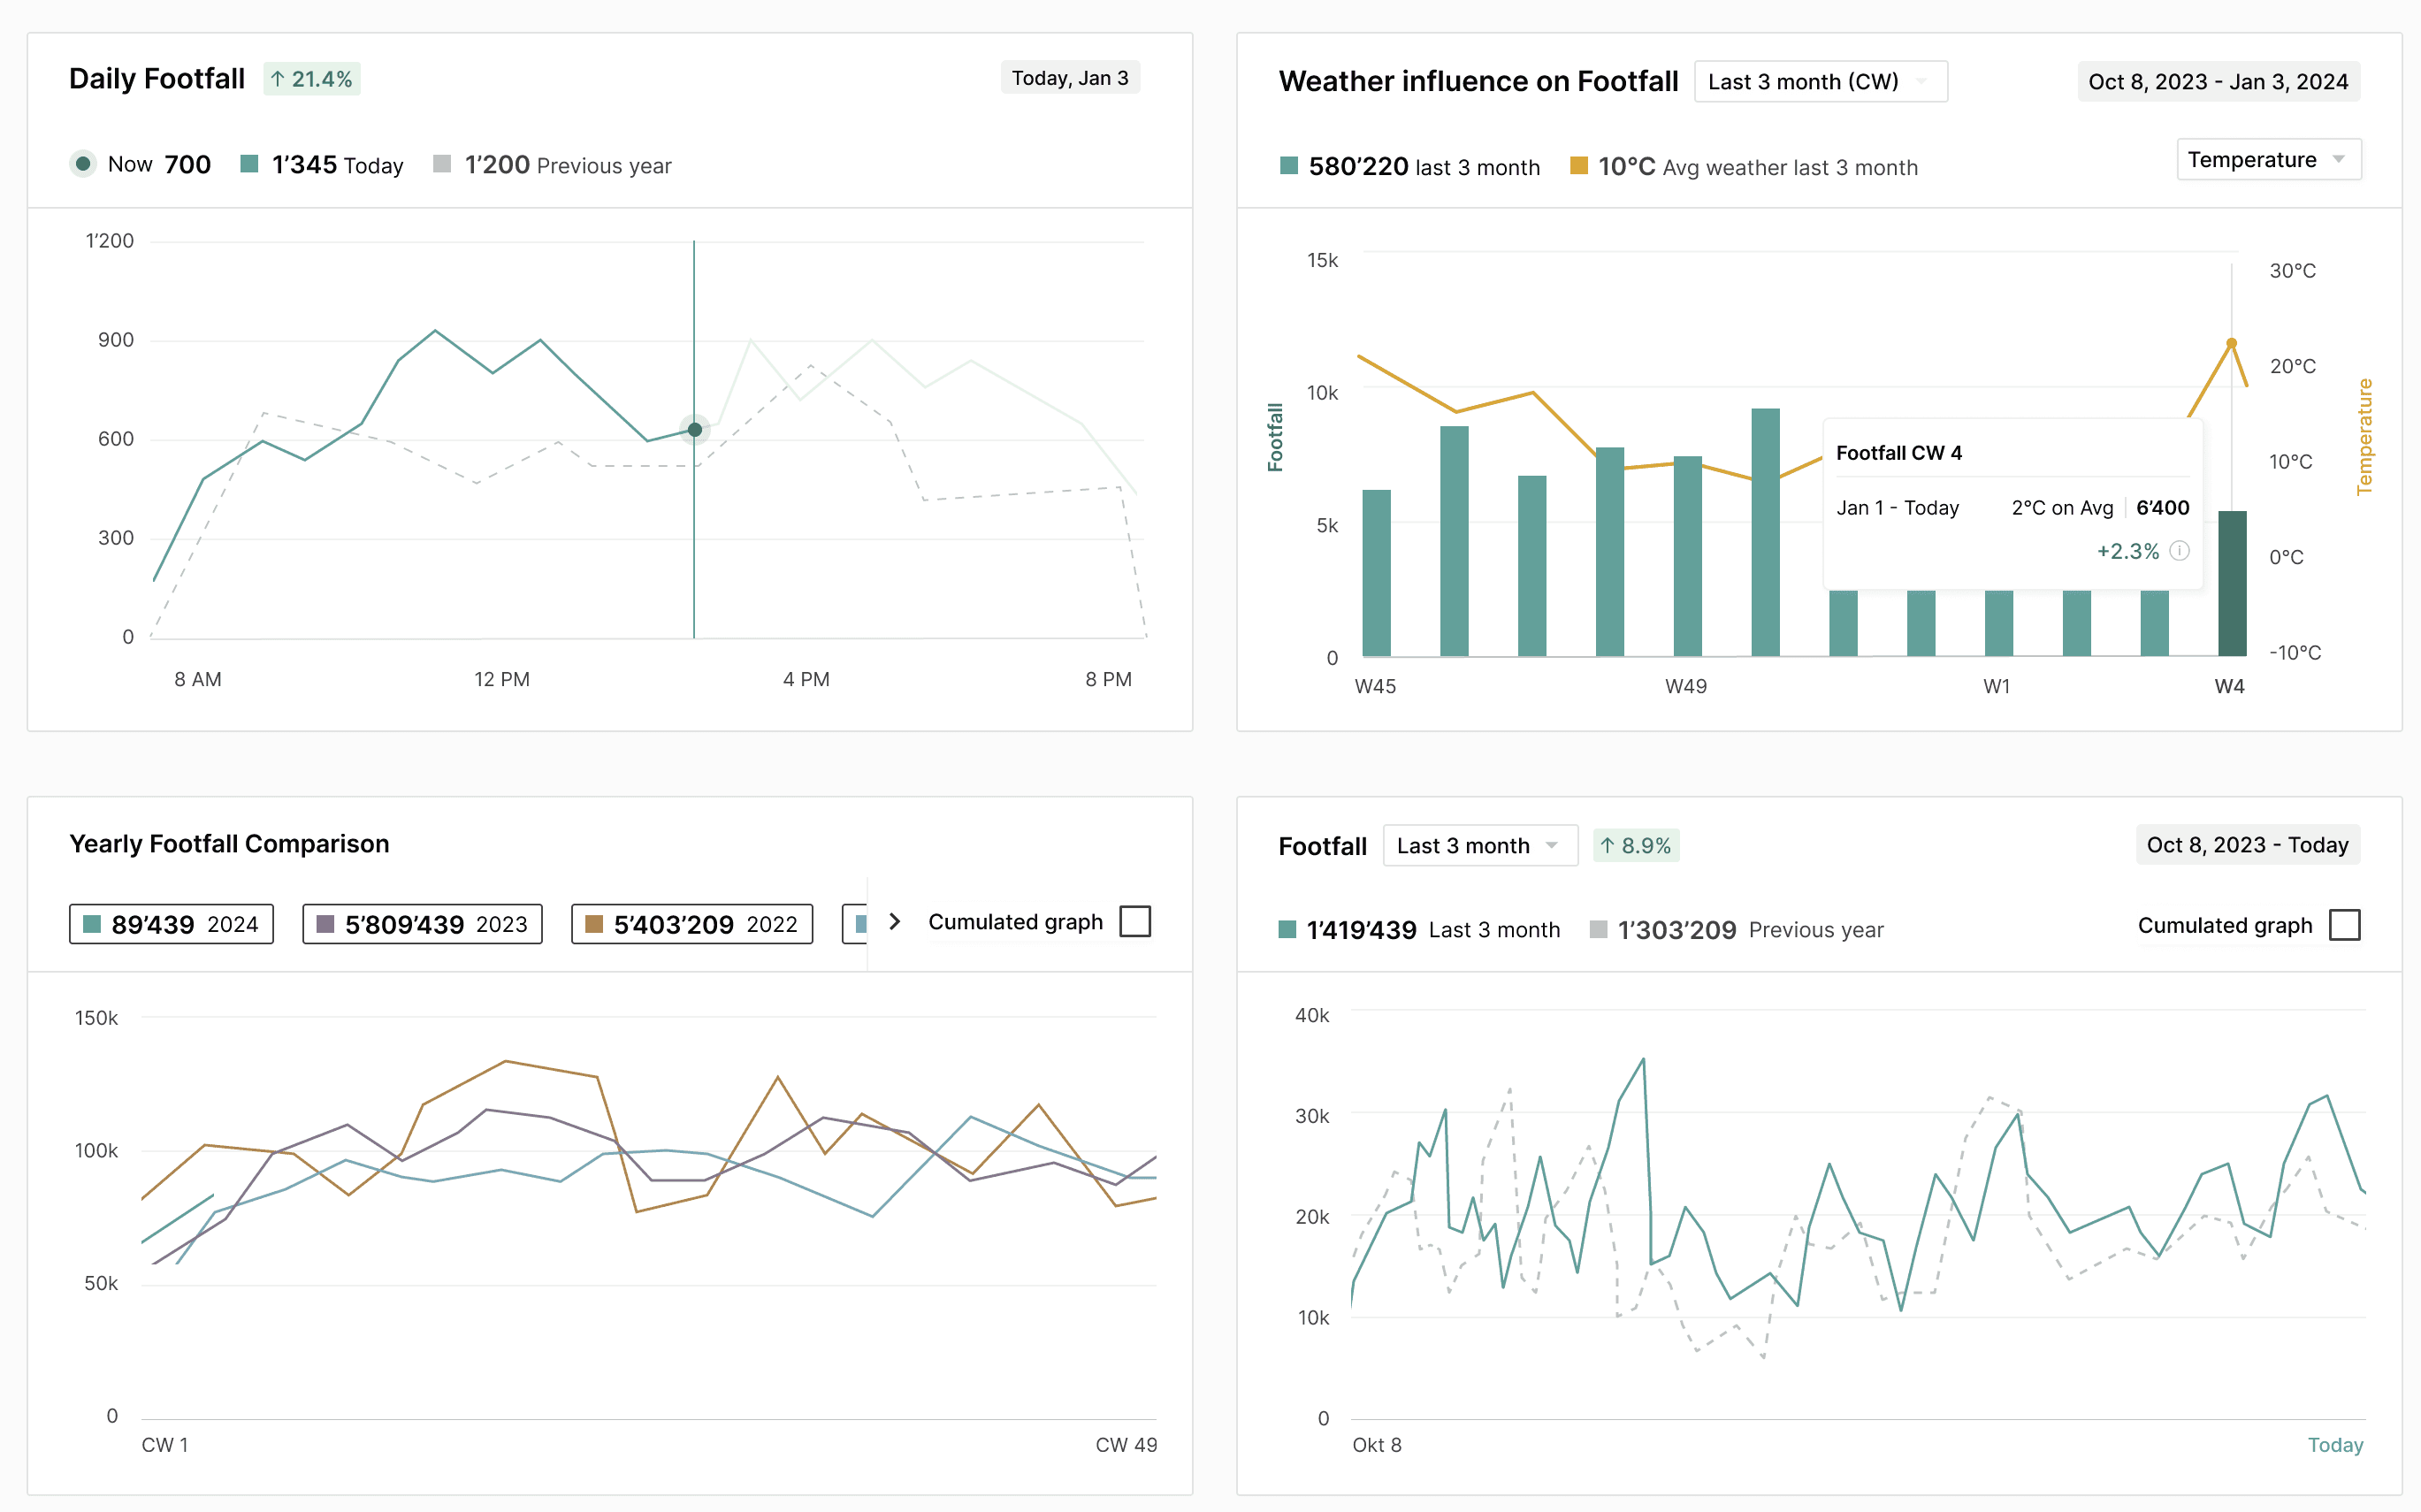
Breaking down the metrics into different time periods for comparison and combining it with other relevant data sets for deeper insights.
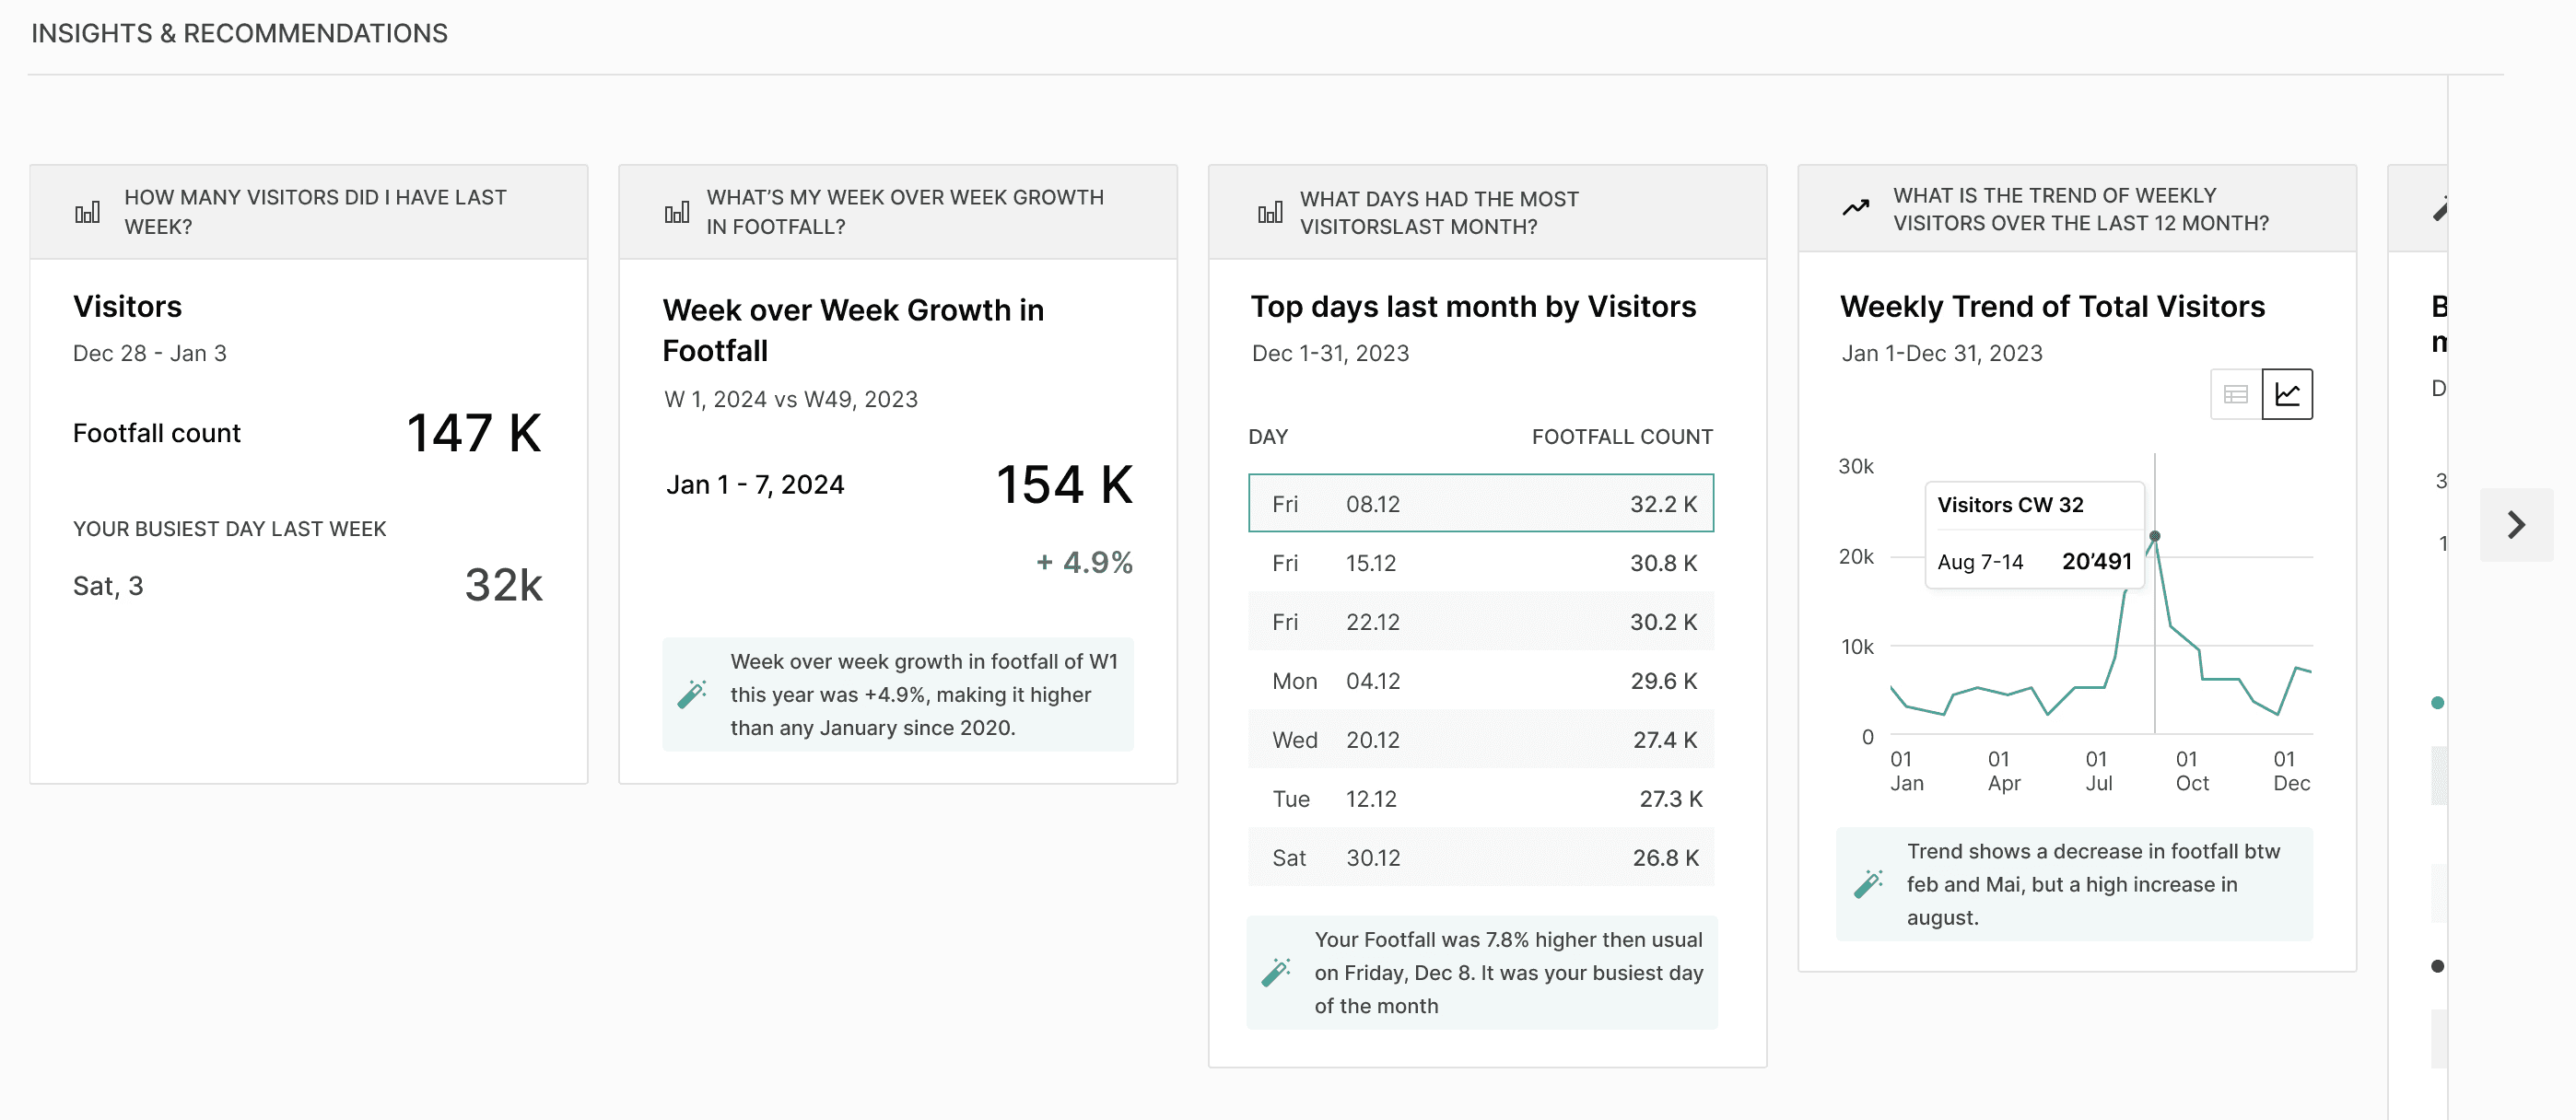
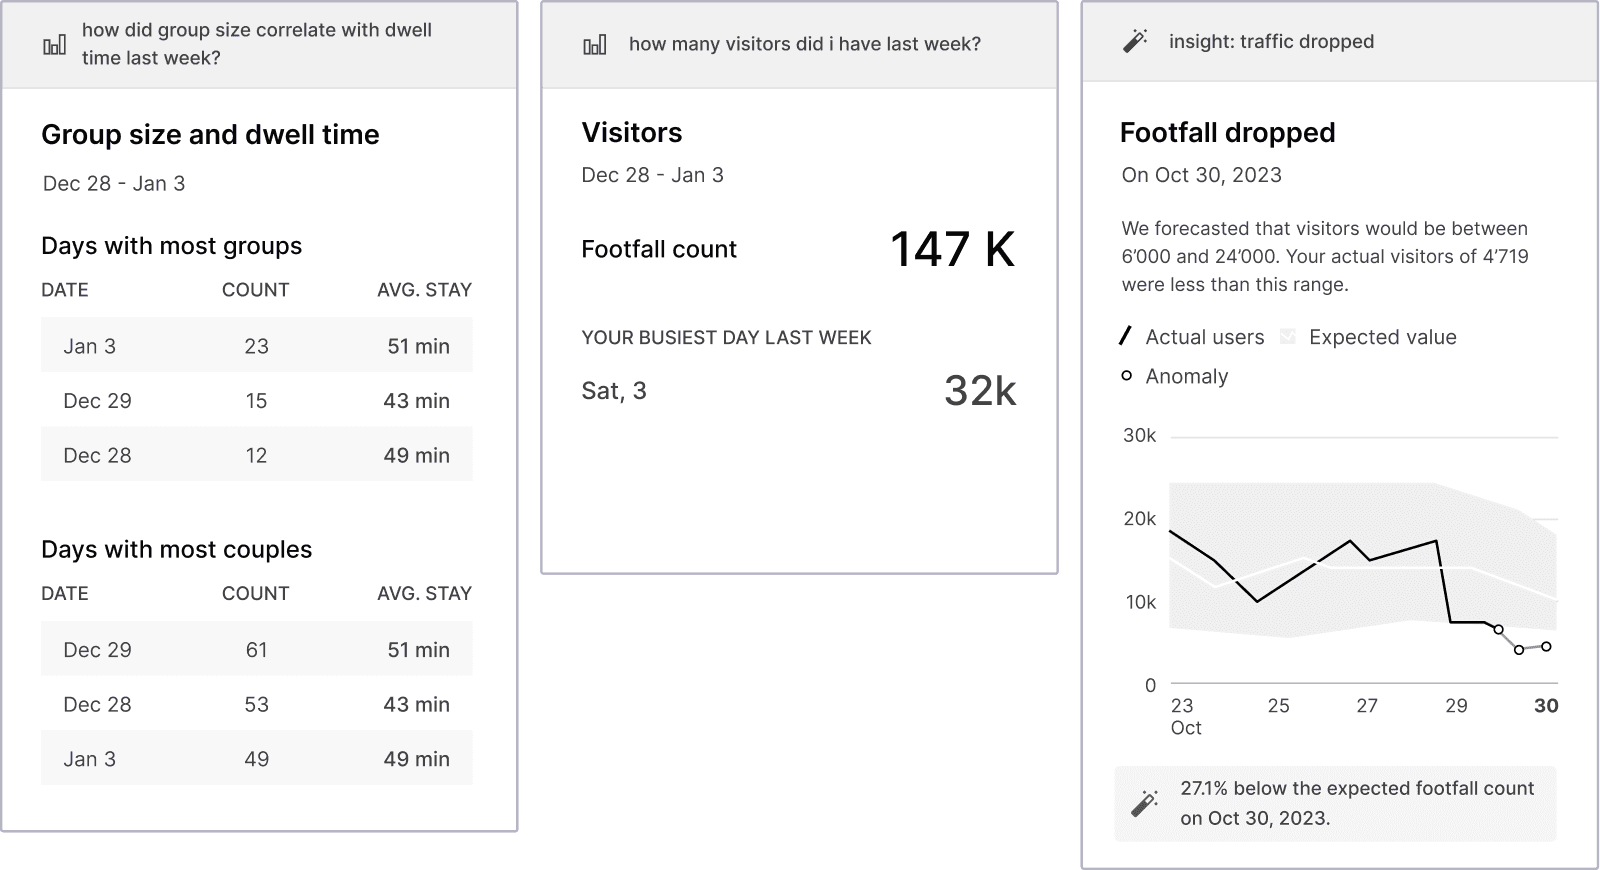
In the last section, insights & recommendations, we explored the use of analytics Intelligence, to spot trends and changes. Mall managers can be notified if trends shift. Such intelligence can be used to analyse user behaviour and suggest relevant data points, visualisations, or insights based on their initial exploration patterns. Based on existing datasets we conceptualised how smart actionable insights could be derived from the data shown in the graphs.
